Licence of this site’s content
The text on Data Trade Systems is original writing that draws on the Wikipedia articles and academic papers listed at the end of each page. To stay compatible with Wikipedia’s licence, all Data Trade Systems text is released under the Creative Commons Attribution-ShareAlike 4.0 International licence (CC BY-SA 4.0). You may share and adapt it, including commercially, as long as you give credit and share your adaptations under the same licence.
All charts marked “Data Trade Systems analytics” are generated by this site’s own Python service from simulated data and are released under CC BY-SA 4.0 as well.
Images from Wikimedia Commons
Photographs and diagrams are sourced from Wikimedia Commons. The site’s seeding script retrieves each file’s licence and author through the Commons API when it publishes the site, and only accepts Creative Commons or public-domain files. Each image is credited in its caption, and the full list is below.
| Image | Attribution | Licence |
|---|---|---|
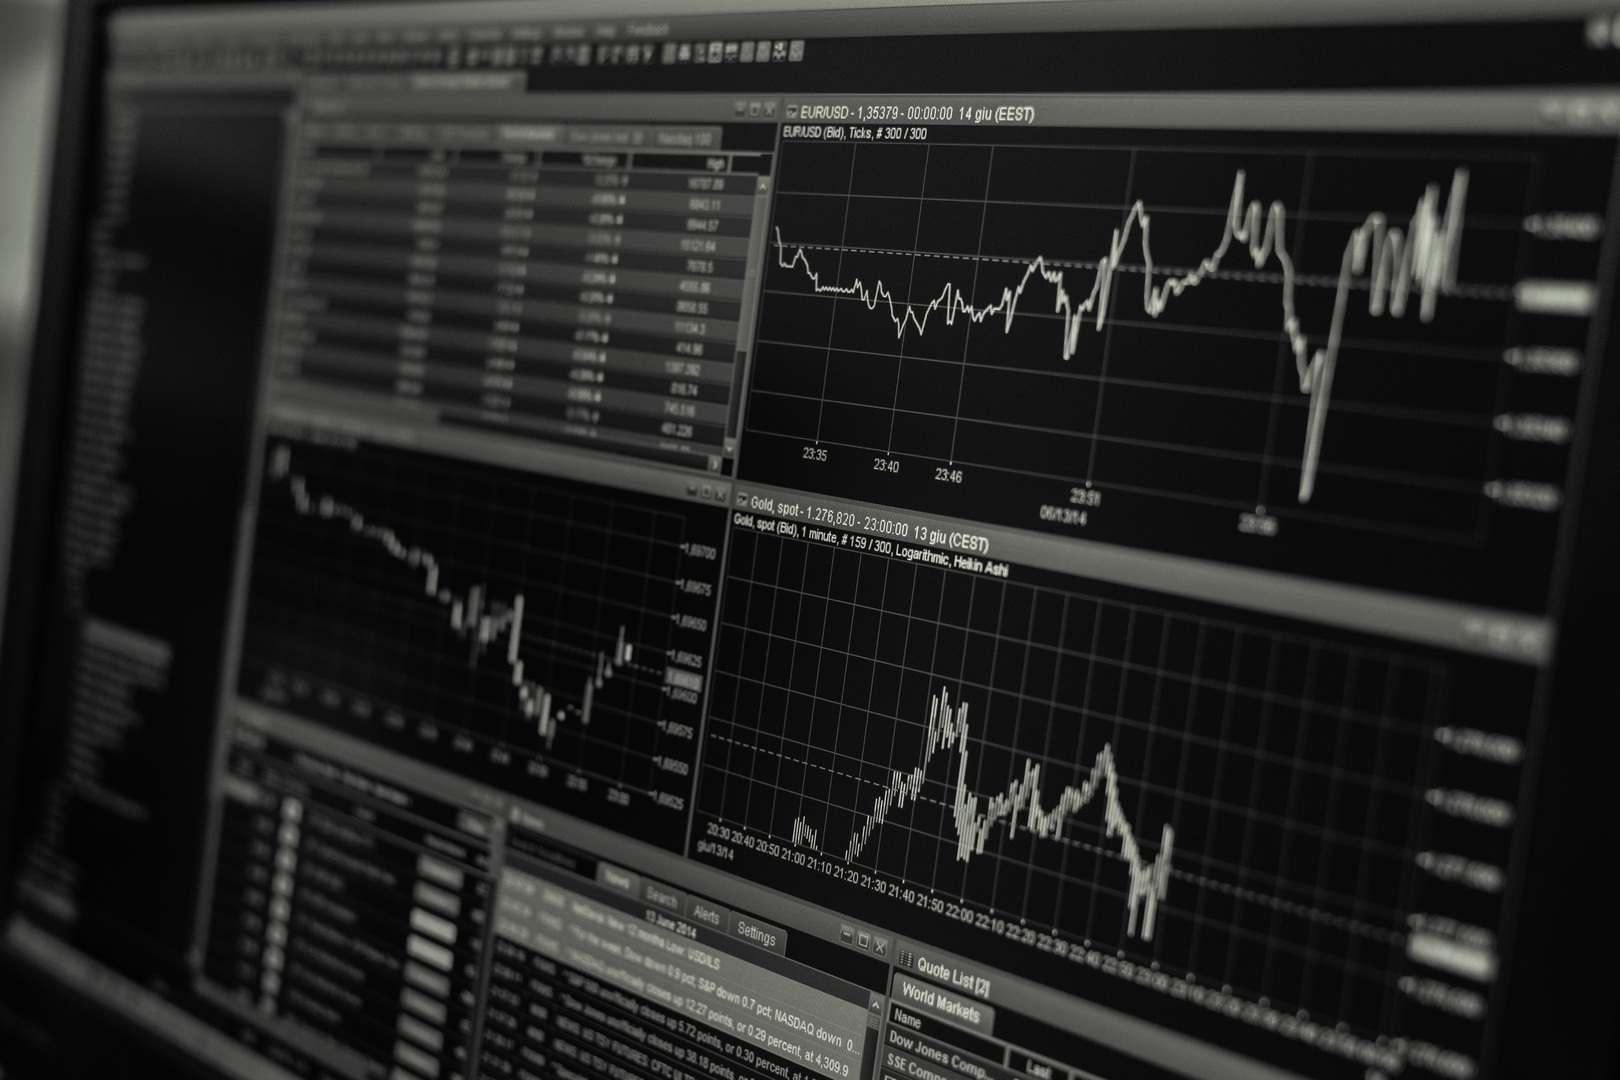 | “Stock market charts illustration” by Unknown author Unknown author, via Wikimedia Commons, CC0 | CC0 |
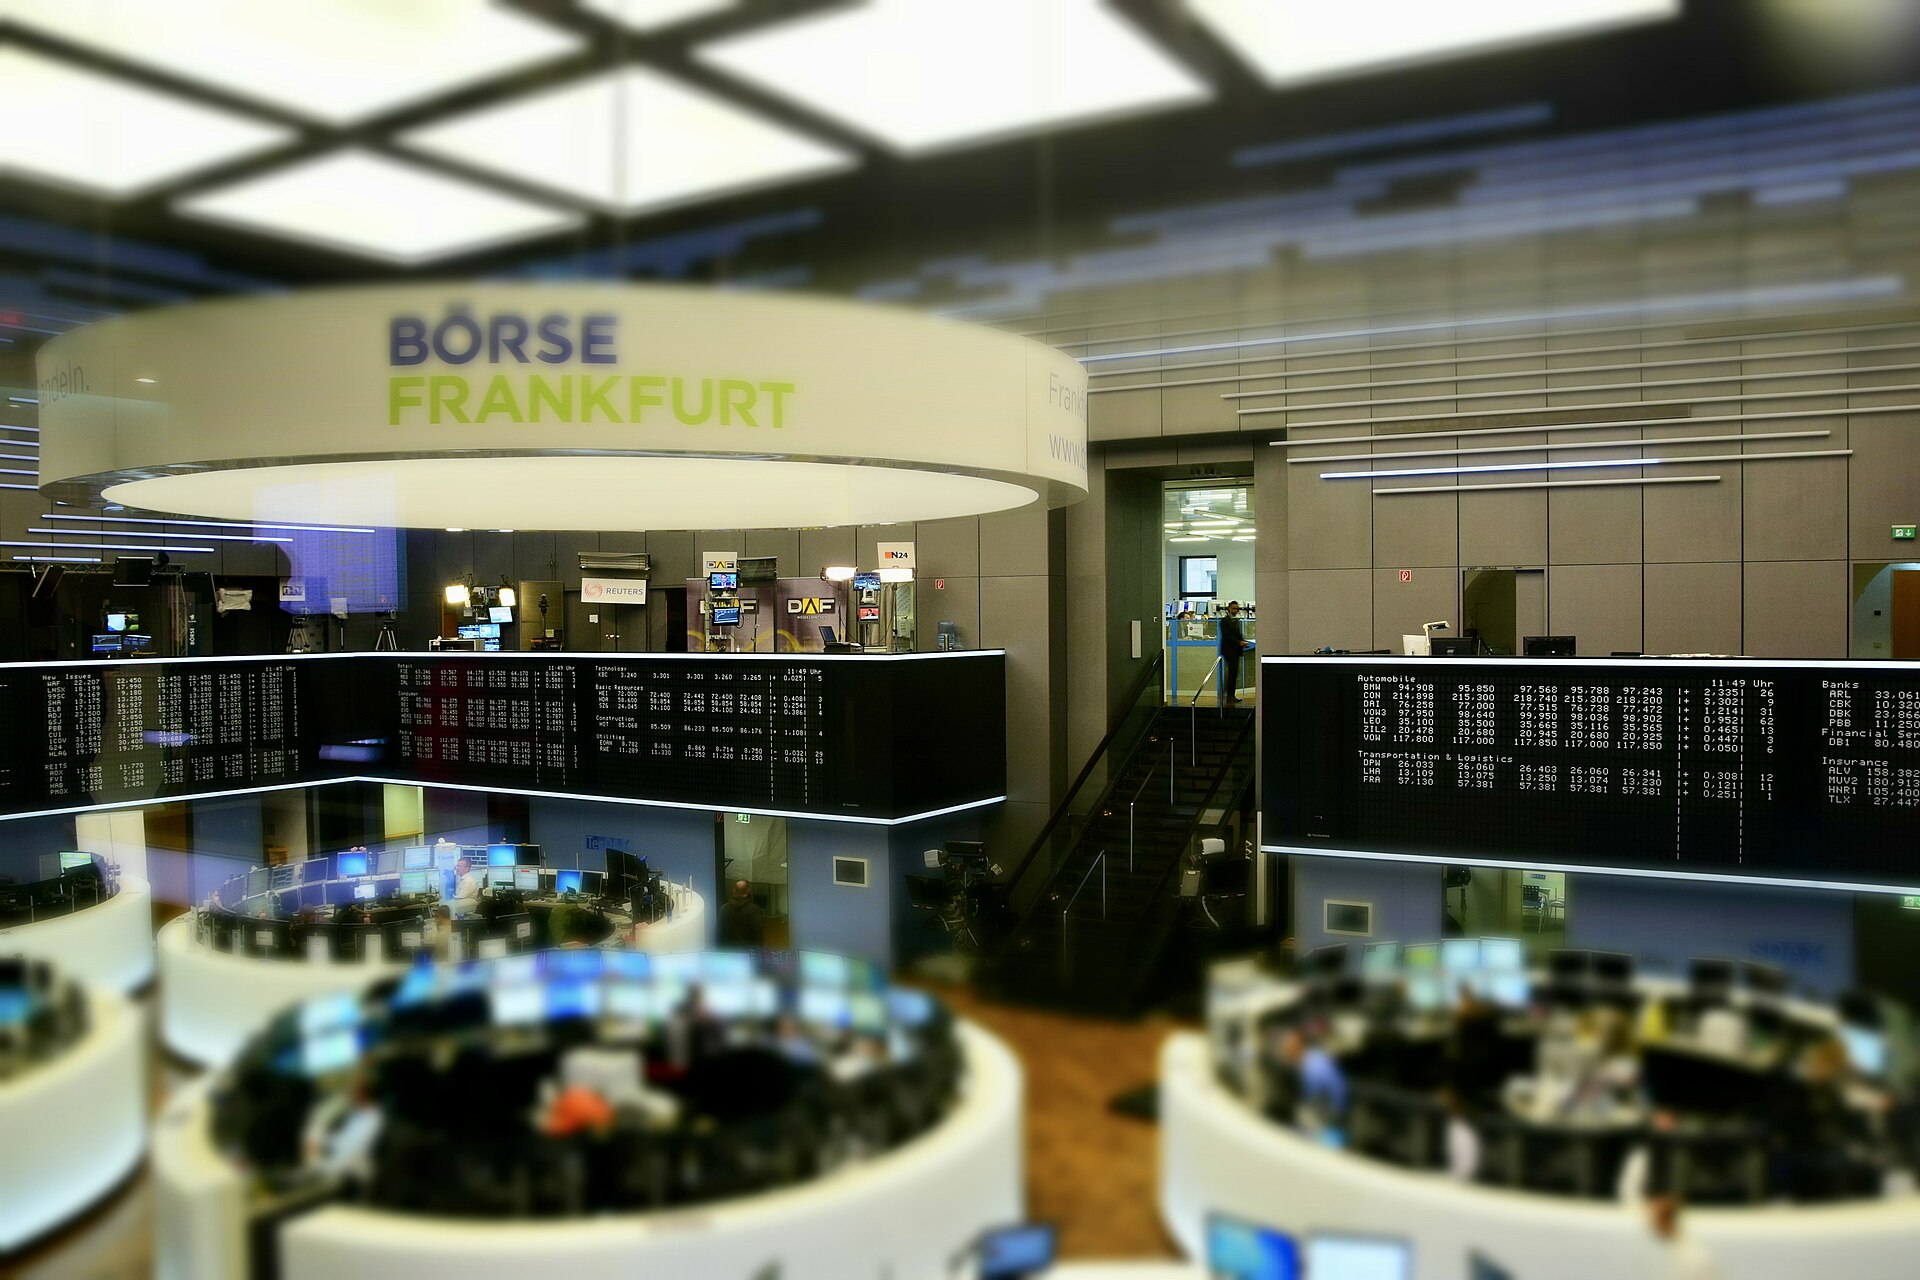 | “Frankfurt Stock Exchange (Ank Kumar) 03” by Ank Kumar, via Wikimedia Commons, CC BY-SA 4.0 | CC BY-SA 4.0 |
 | “Wall-Street-Sign-New-York” by Acediscovery, via Wikimedia Commons, CC BY 4.0 | CC BY 4.0 |
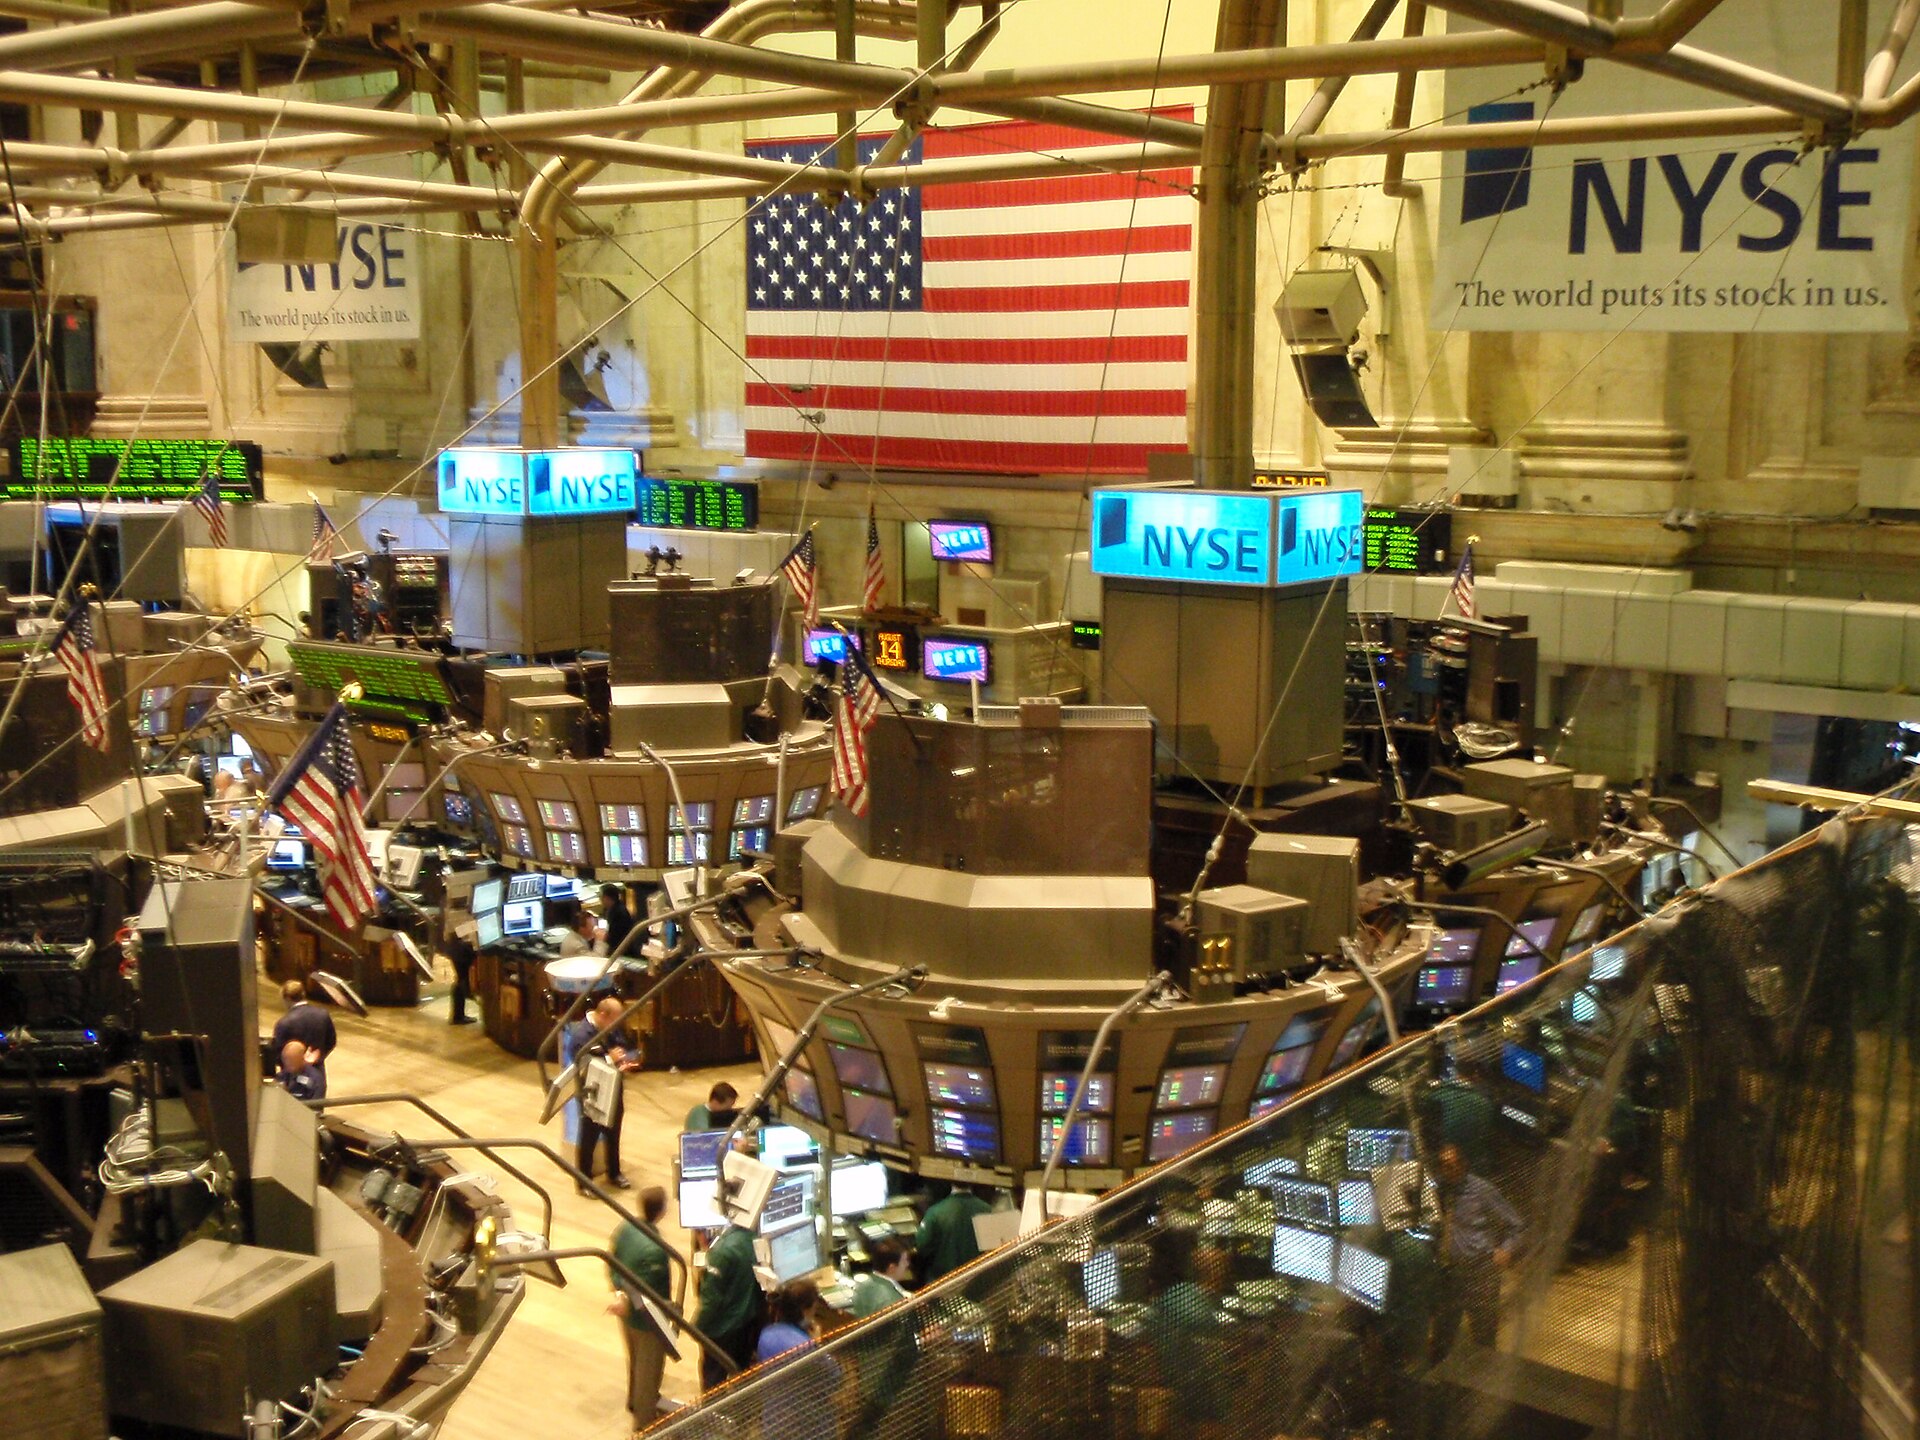 | “NYSE127” by Ryan Lawler, via Wikimedia Commons, Public domain | Public domain |
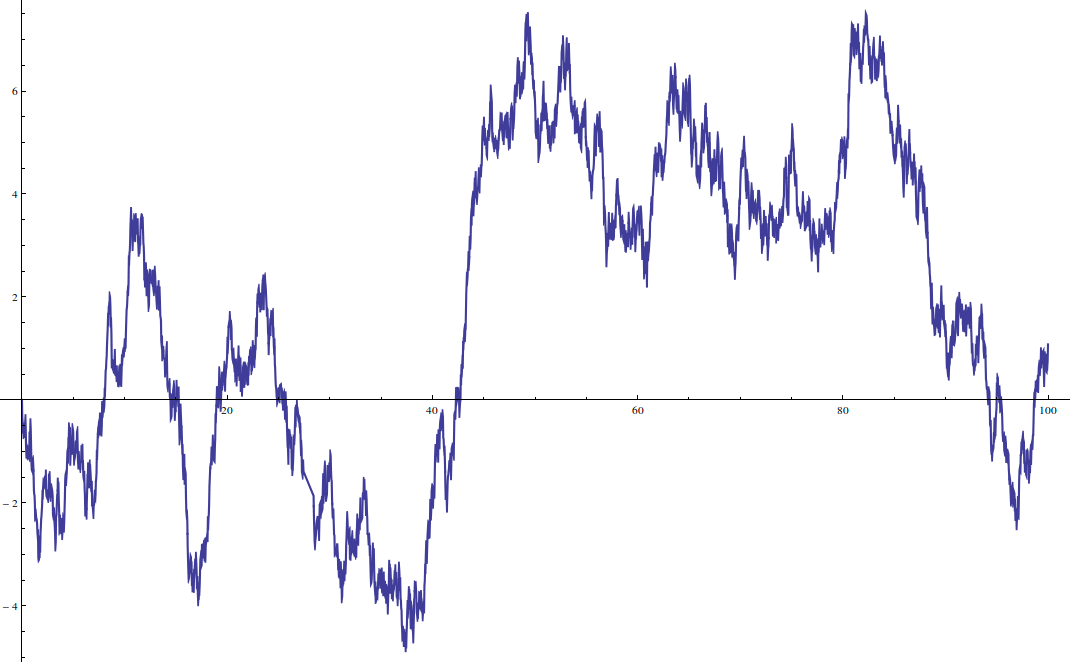 | “Random walk simulation” by Sławomir Biały, via Wikimedia Commons, CC BY-SA 4.0 | CC BY-SA 4.0 |
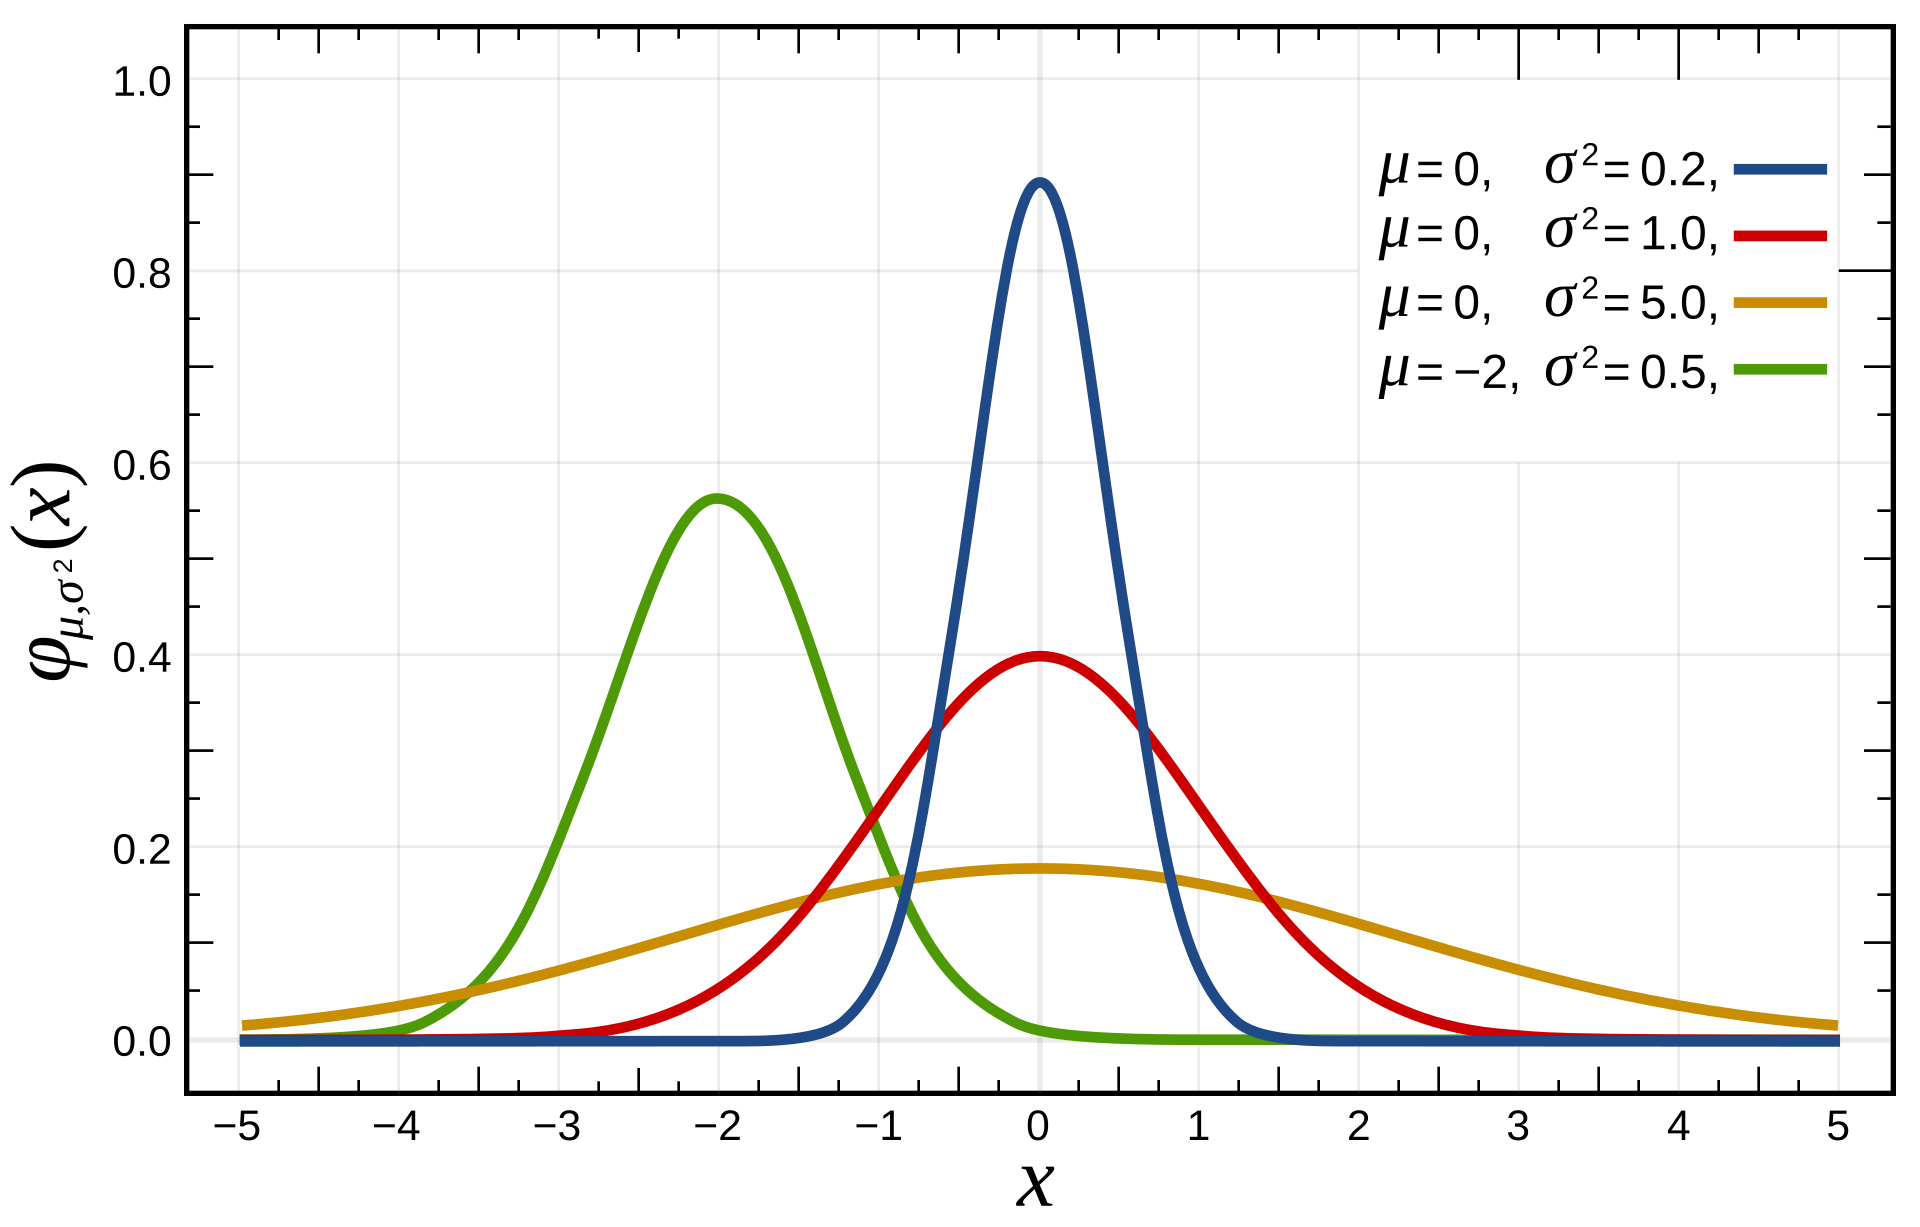 | “Normal Distribution PDF” by Inductiveload, via Wikimedia Commons, Public domain | Public domain |
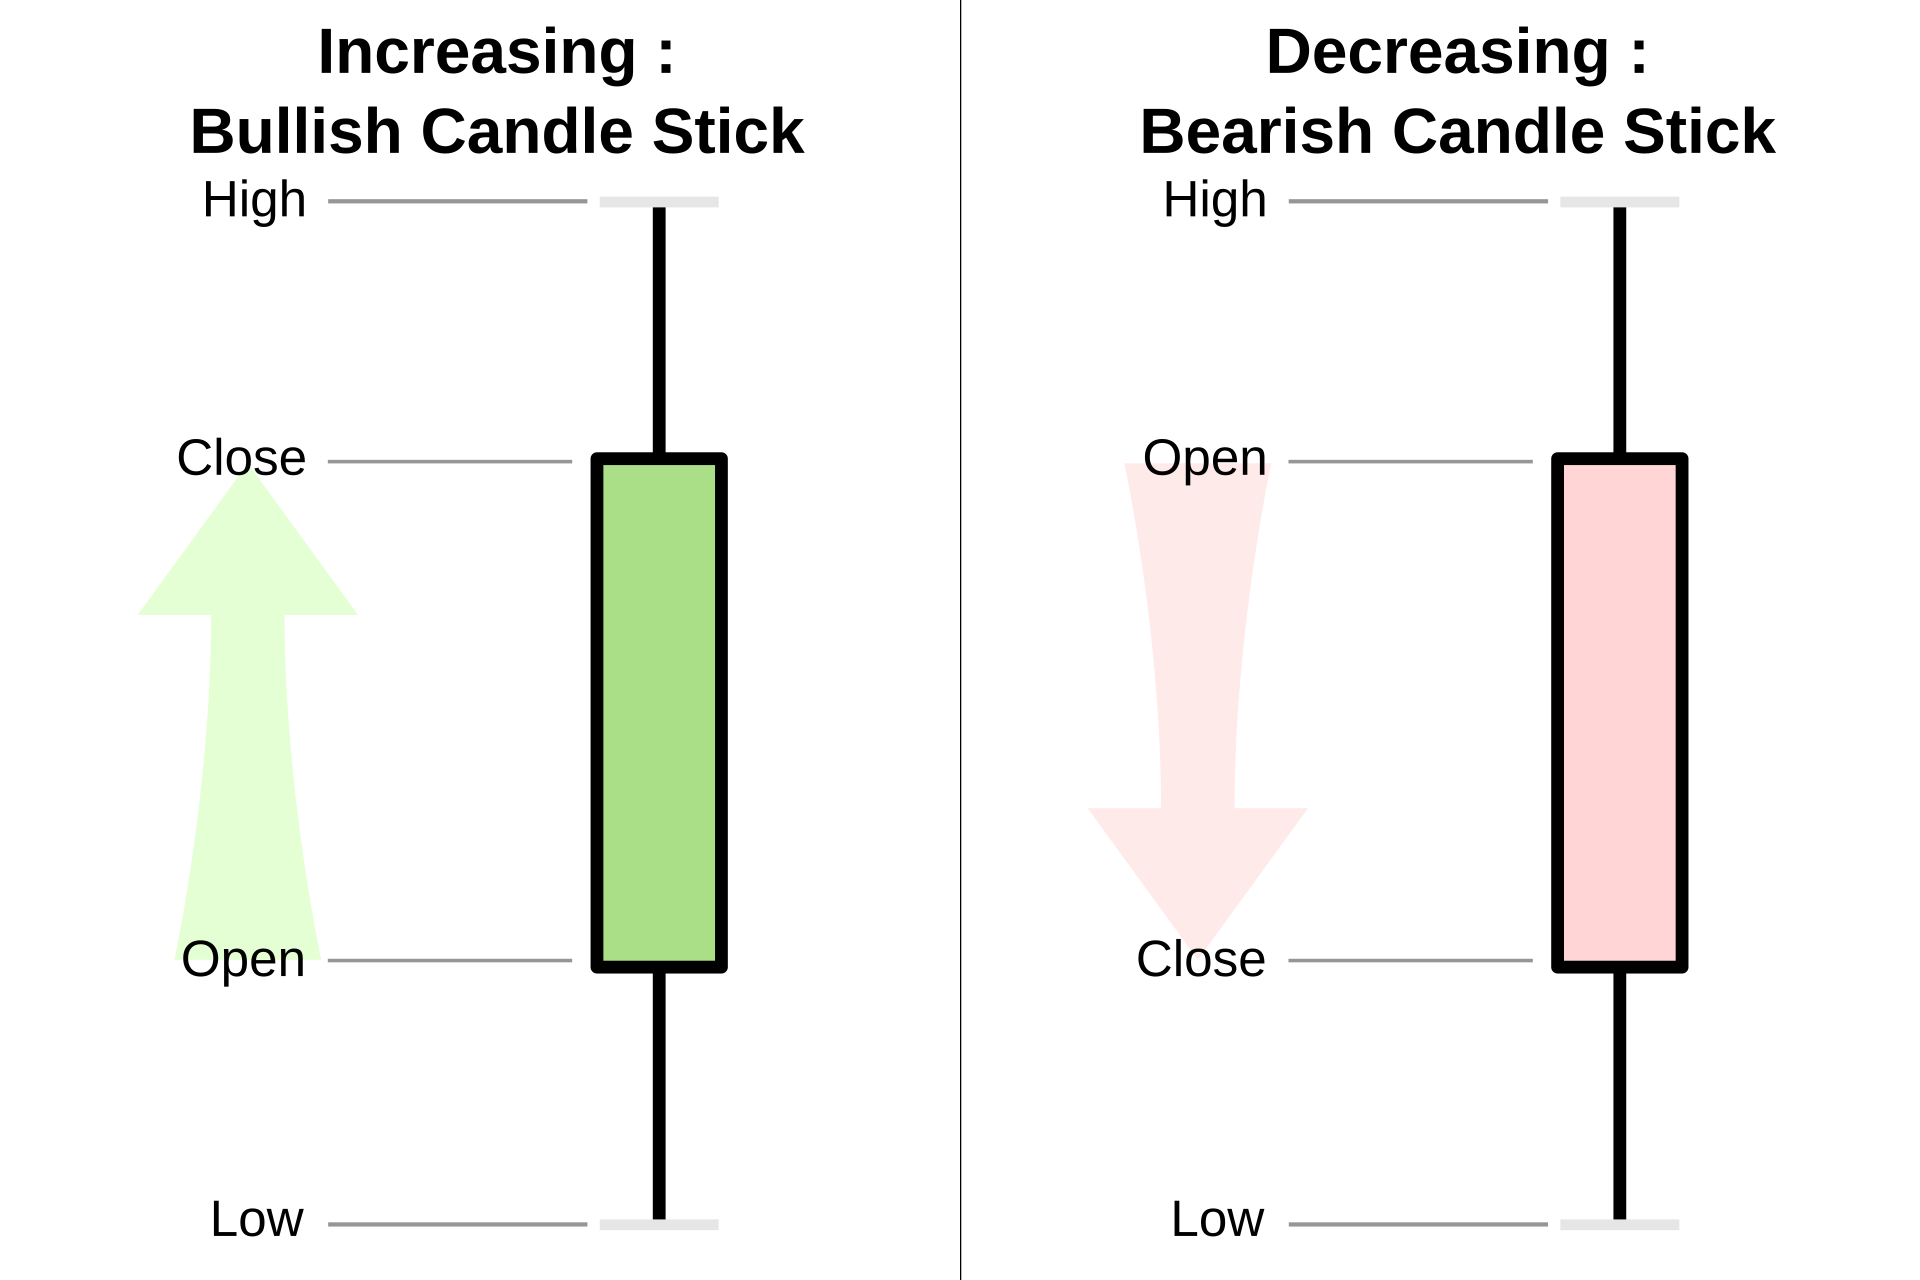 | “Candlestick chart scheme 03-en” by Probe-meteo.com, via Wikimedia Commons, CC BY-SA 3.0 | CC BY-SA 3.0 |
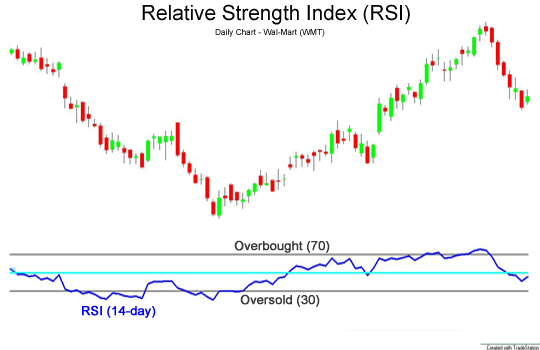 | “RSIwiki” by Tradermatt at English Wikipedia, via Wikimedia Commons, Public domain | Public domain |
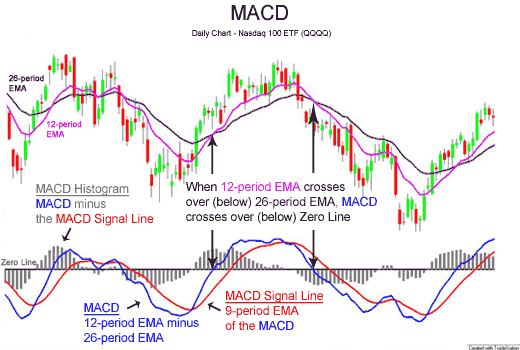 | “MACDpicwiki” by Tradermatt at English Wikipedia, via Wikimedia Commons, CC BY-SA 3.0 | CC BY-SA 3.0 |
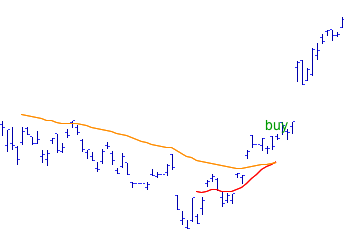 | “Moving average crossover” by Henry Larkin, via Wikimedia Commons, CC BY-SA 3.0 | CC BY-SA 3.0 |
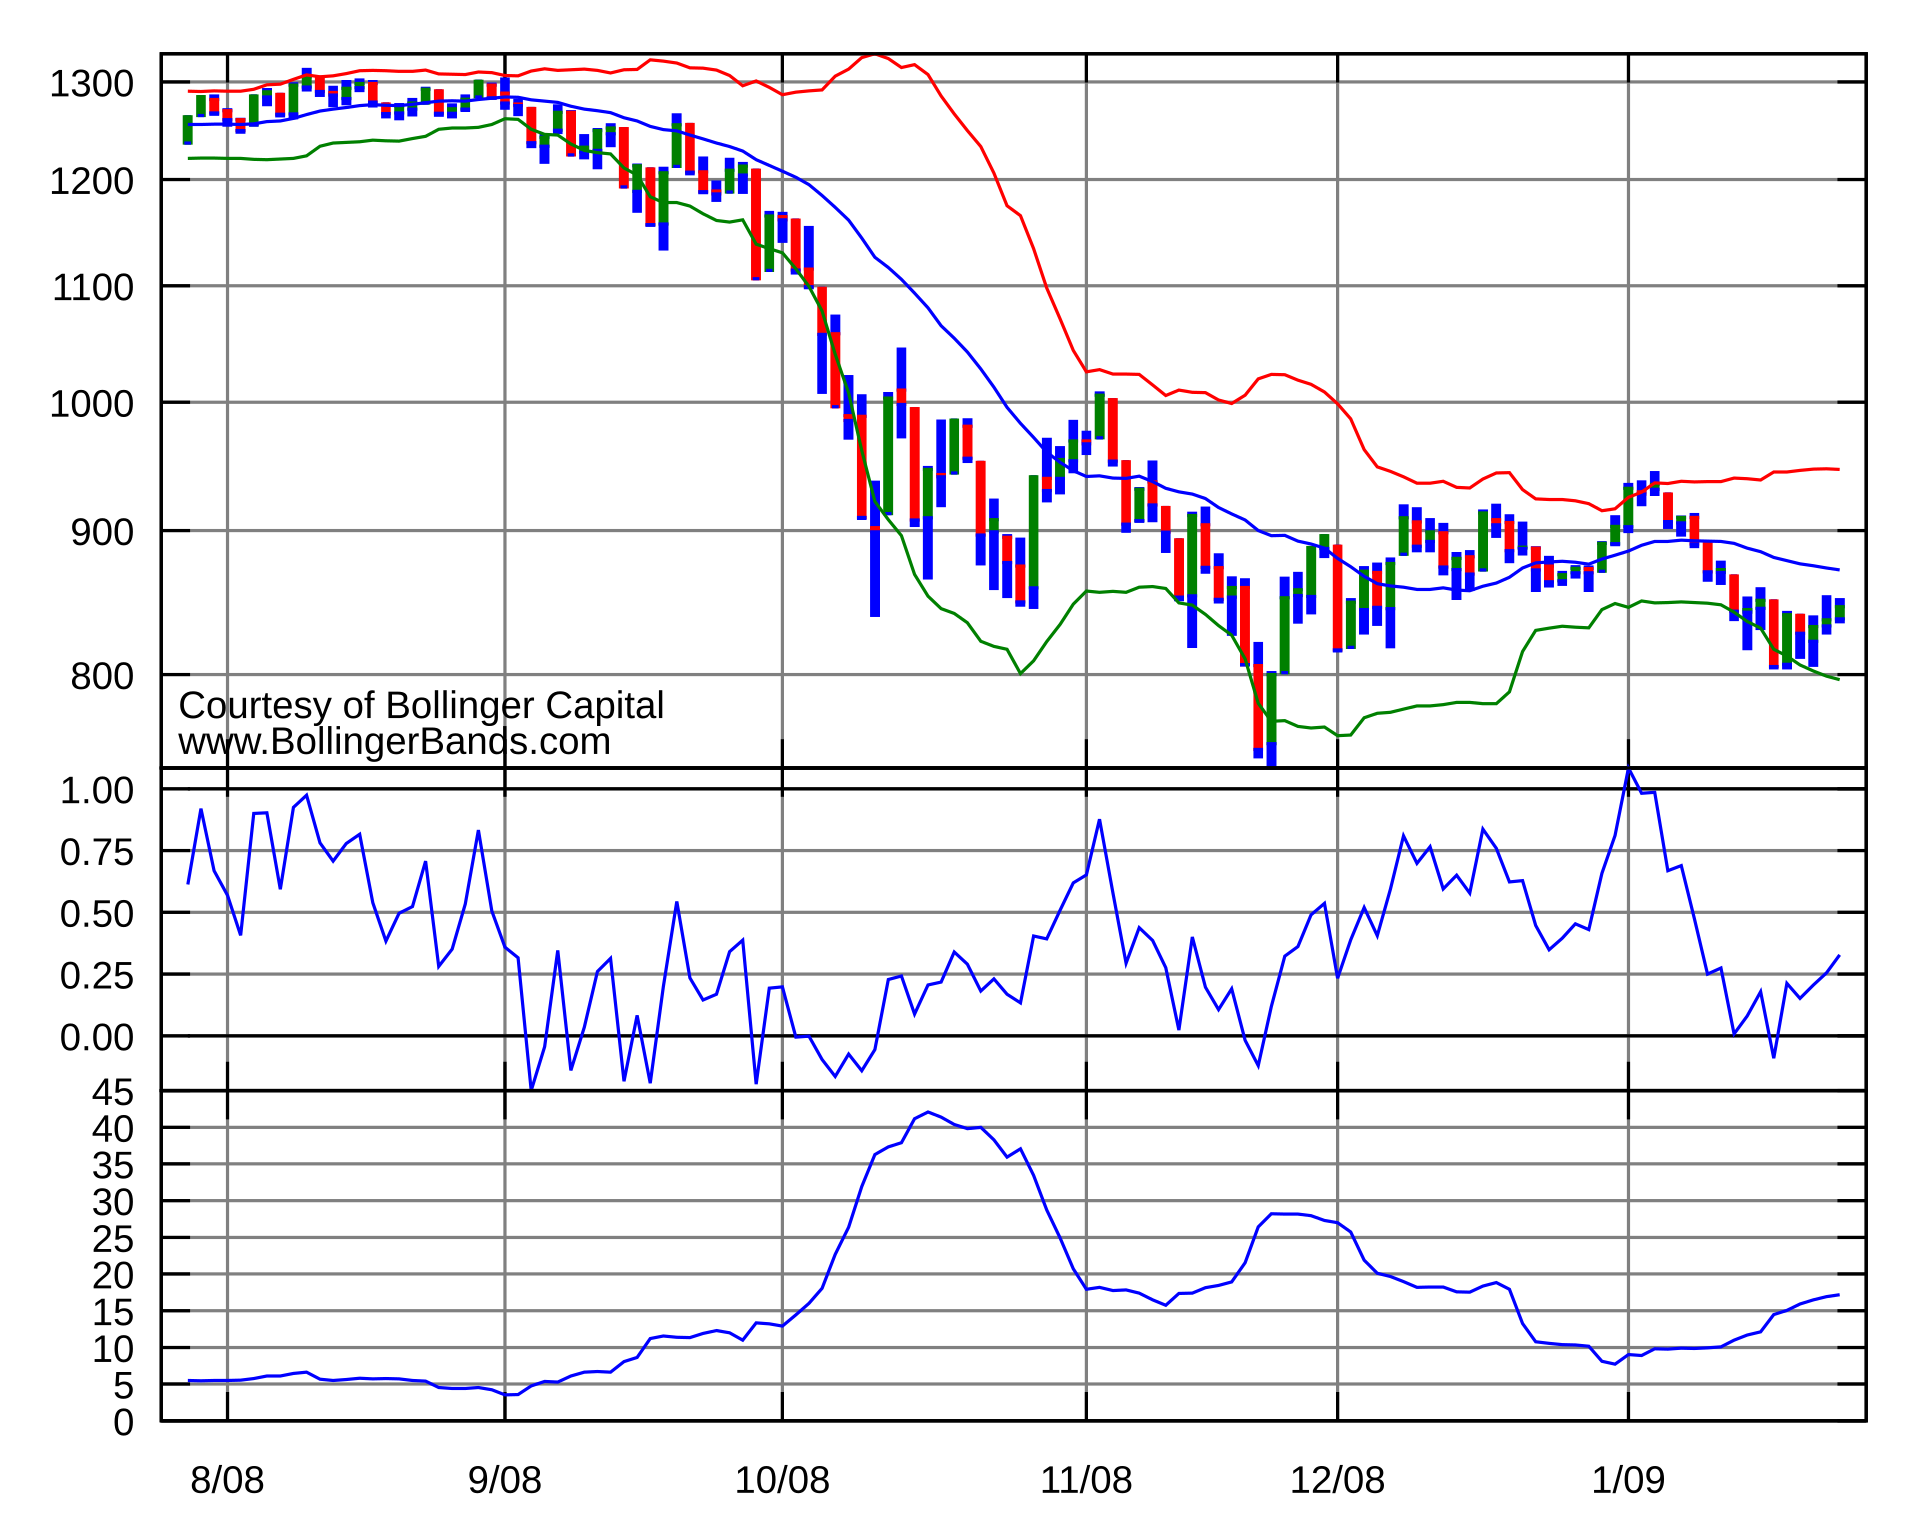 | “BollingerBandsSPX” by Bbands, via Wikimedia Commons, CC BY-SA 3.0 | CC BY-SA 3.0 |
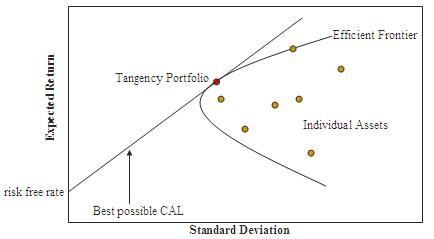 | “Markowitz frontier” by User:G2010a, via Wikimedia Commons, Public domain | Public domain |
 | “BalticServers data center” by BalticServers.com, via Wikimedia Commons, CC BY-SA 3.0 | CC BY-SA 3.0 |
Text sources
The articles below informed the content of this site. Wikipedia text is available under CC BY-SA 4.0. Each article’s history page lists its authors.
- Efficient-market hypothesis, Random walk hypothesis, Behavioral economics, Adaptive market hypothesis, Fat-tailed distribution
- Technical analysis, Candlestick chart, Moving average, Relative strength index, MACD, Bollinger Bands
- Trend following, Momentum investing, Donchian channel, Richard Dennis
- Mean reversion (finance), Pairs trade, Cointegration, Statistical arbitrage
- Kelly criterion, Modern portfolio theory, Drawdown (economics), Value at risk
- Backtesting, Overfitting, Survivorship bias, Sharpe ratio
Academic papers are cited by author, year and journal at the foot of each page. They are referenced for further reading only, and no text from them is reproduced.
Software
Built with WordPress (GPL), Python, FastAPI, pandas, NumPy and Matplotlib.