Trade on evidence, not hunches.
Data Trade Systems is an open guide to stock trading driven by data analysis: the theory behind price behaviour, the strategies built on it, and the statistics that separate a real edge from a lucky backtest.
Start with the theory Open the Strategy Lab
Why data-driven trading?
Most trading decisions are still made on stories: a confident headline, a chart pattern that “looks like” last year’s rally, a tip from a friend. Data-driven trading replaces the story with a hypothesis that can be written down, measured on historical data and rejected if it fails. Every rule is explicit, so it can be tested before money is at risk, and every result is a number that can be compared with a simple benchmark such as buying and holding the market.
This does not make trading easy. Markets are noisy, competitive and constantly changing, and the tools of quantitative analysis are just as good at fooling you as they are at informing you. The aim of this site is to show both sides: what the data can tell you, and how to avoid hearing what you want to hear.
Market Theory
Efficient markets, random walks, fat-tailed returns and the behavioural biases that create opportunities.
02 · ToolsCharts & Indicators
Candlesticks, moving averages, RSI, MACD and Bollinger Bands, defined precisely and computed in Python.
03 · StrategyTrend Following
Moving-average crossovers, channel breakouts and the evidence for time-series momentum.
04 · StrategyMean Reversion
Fading extremes with bands and oscillators, and pairs trading of cointegrated stocks.
05 · SurvivalRisk Management
Position sizing, volatility targeting, the Kelly criterion and why drawdowns matter more than returns.
06 · ValidationBacktesting
Look-ahead and survivorship bias, overfitting, walk-forward tests and honest performance metrics.
A strategy, end to end
The chart below is produced live by the site’s Python analytics service. A simple rule (hold the stock while its 20-day moving average is above its 50-day average) is applied to a simulated price series. The top panel shows where the rule buys and sells. The bottom panel compares the resulting equity curve with buying and holding. Transaction costs are included, and every signal is acted on only on the following day, so the rule never uses information it would not have had.
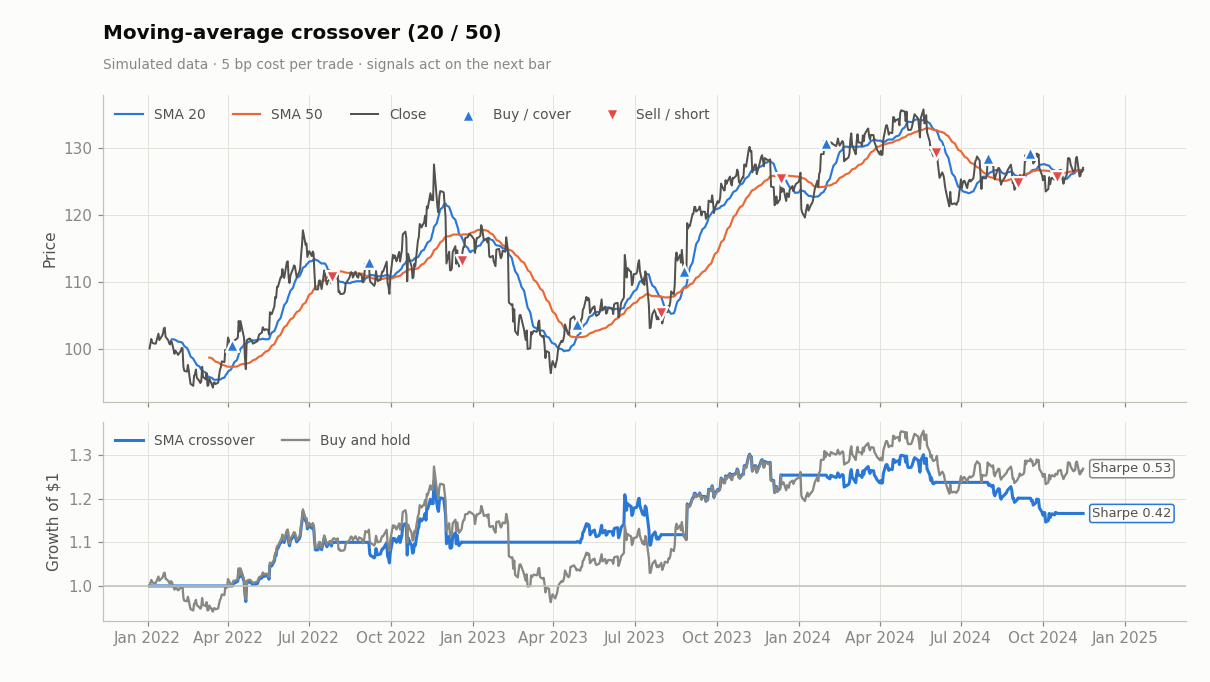
Notice what the comparison reveals: the rule sits out some of the deepest declines but also gives back gains each time a trend fades and the averages cross back. Whether that trade-off is worth it is exactly the kind of question this site teaches you to answer with data. Try other rules and parameters in the Strategy Lab.

The data-driven workflow
- Observe. Start from an economic or behavioural reason why prices might be predictable, such as slow diffusion of news, forced selling or risk premia.
- Formalise. Turn the idea into unambiguous rules: entry, exit, position size, universe and costs.
- Test. Run the rules on historical data while guarding against look-ahead bias, survivorship bias and overfitting.
- Validate. Confirm the result out of sample, in walk-forward tests and on other markets.
- Size & control risk. Decide how much capital to put at risk, and under what conditions to stop.
- Monitor. Compare live results with expectations, because edges decay as they become known.
Educational content only. Nothing on Data Trade Systems is investment advice. All charts use simulated prices so they can be reproduced and freely licensed, and simulated or historical performance does not predict future results.
How this site is built
Data Trade Systems runs on WordPress for content and a Python (FastAPI, pandas, matplotlib) service for anything computational: indicator calculations, strategy backtests, chart rendering and the interactive lab. Images are sourced from Wikimedia Commons under Creative Commons or public-domain licences and credited beneath each figure. See Sources & Credits for the full list.