Trend following is the oldest and simplest systematic strategy: buy what is going up, sell what is going down, and let the market decide when you are wrong. It makes no forecast of how far a move will go. It only assumes that, on average, trends persist a little longer than a random walk would allow, and that the occasional large trend pays for many small losses.

Why trends exist
Several mechanisms, some behavioural and some structural, can make returns positively autocorrelated over horizons of weeks to months:
- Under-reaction: information diffuses gradually through investors, so prices adjust in steps rather than all at once.
- Herding and feedback: rising prices attract buyers, and some institutions mechanically add to winners.
- Slow-moving fundamentals: economic cycles, central-bank policy and earnings revisions unfold over quarters.
- Hedging and risk-management flows: stop-losses, portfolio insurance and volatility-targeting funds sell into declines and buy into rallies.
The evidence is substantial. Moskowitz, Ooi and Pedersen (2012) documented time-series momentum: an asset’s own past 12-month return predicts its next month’s return across 58 futures and forward contracts. Hurst, Ooi and Pedersen (2017) found trend-following profits in data going back to 1880. Separately, Jegadeesh and Titman (1993) documented cross-sectional momentum in US stocks: past winners continue to outperform past losers over 3–12 months.
Strategy 1: Moving-average crossover
The classic rule compares a fast and a slow moving average:
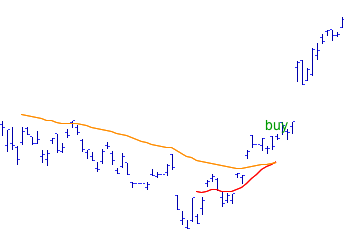
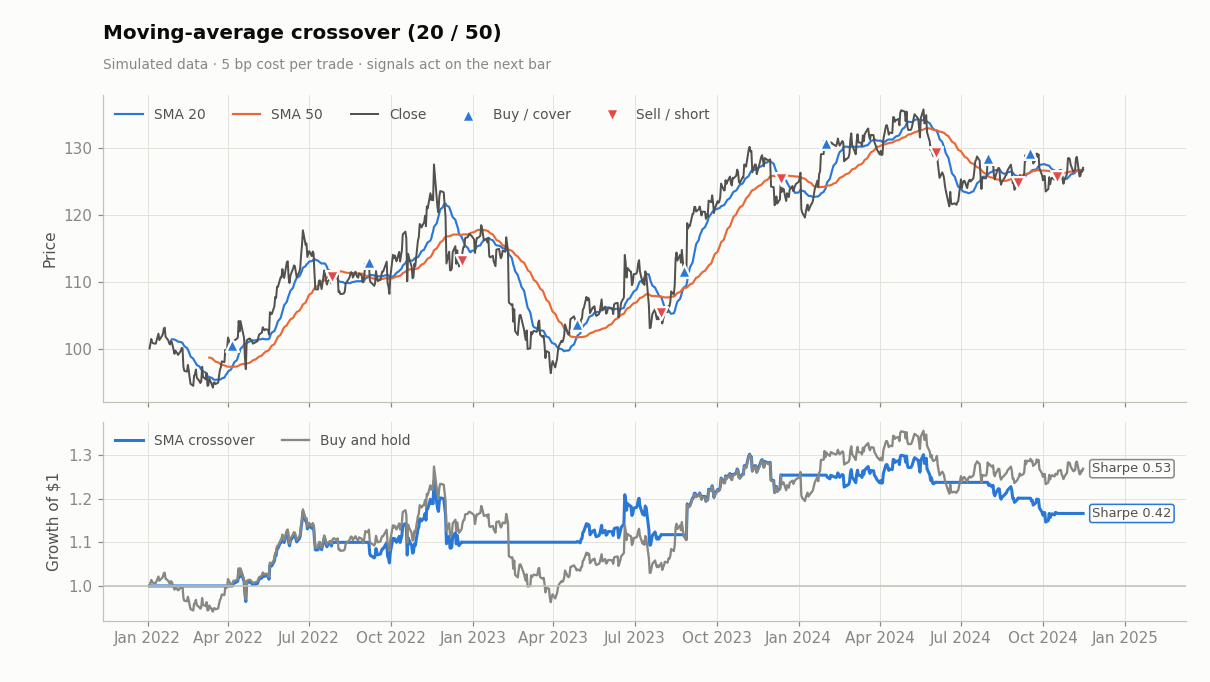
When the fast average crosses above the slow one, the recent trend is up and the rule buys. When it crosses back, the rule exits. The chart below runs a 20/50-day crossover on simulated data. The top panel shows the signals and the bottom panel shows the equity curve against buy-and-hold, after a 5 basis-point cost per trade.
def sma_crossover(df, fast=20, slow=50):
    fast_ma = df["close"].rolling(fast).mean()
    slow_ma = df["close"].rolling(slow).mean()
    return (fast_ma > slow_ma).astype(float)     # decided at today's close

# The backtester holds yesterday's decision over today's return:
held = position.shift(1)
returns = held * df["close"].pct_change() - held.diff().abs() * cost
Look at the pattern of trades. In smooth trends the rule captures most of the move. In sideways markets the averages tangle and the rule whipsaws, buying high and selling low many times in a row. This is the defining feature of trend following: many small losses, few large gains, and long flat periods that test a trader’s discipline.
Strategy 2: Channel breakouts
Richard Donchian, one of the pioneers of systematic futures trading, popularised the price channel: the highest high and lowest low of the past N days. A close above the channel is a breakout to a new high. The famous Turtle Traders, a group recruited and trained in 1983 by Richard Dennis and William Eckhardt, used variants of this rule: enter on a 20- or 55-day breakout, and exit on a 10- or 20-day breakout in the opposite direction.
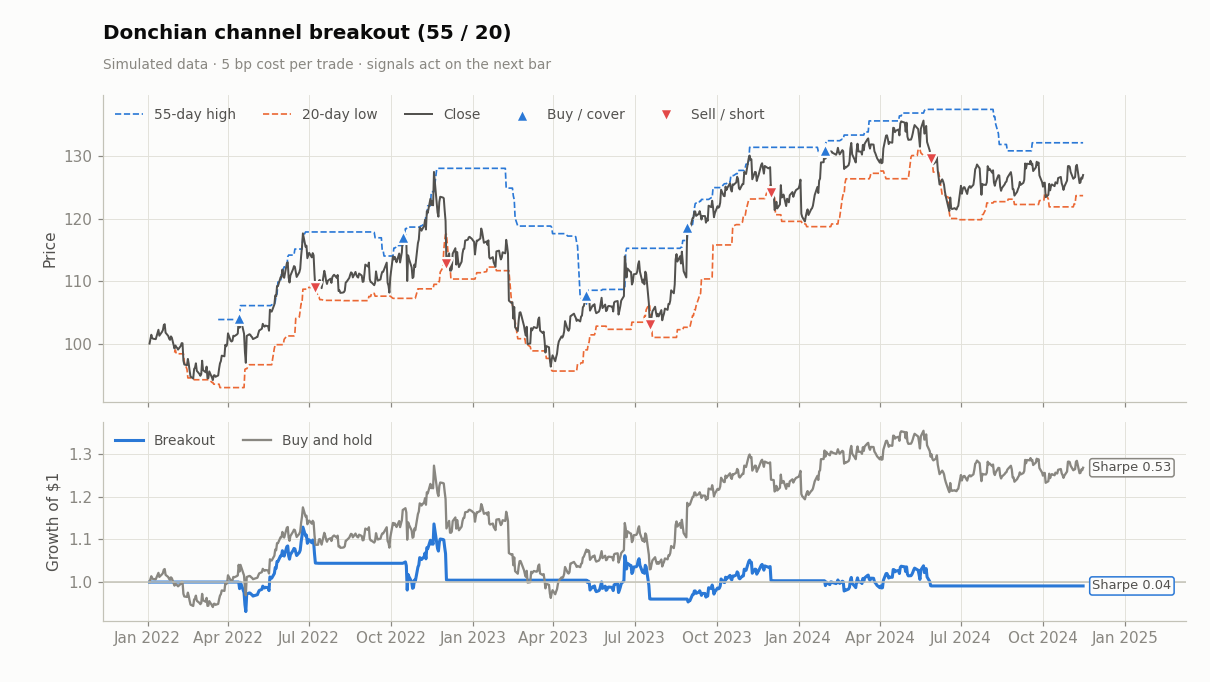
Breakout systems trade less often than crossovers and have an intuitive appeal: the market must prove a trend by making a new high before you commit capital. The asymmetric exit, which is shorter than the entry, cuts losing trades quickly while giving winners room to run.
Strategy 3: MACD and momentum filters
The MACD histogram (see Charts & Indicators) can be used directly as a trend filter by holding the stock while the histogram is positive. More robust implementations used by trend-following funds blend several lookbacks (for example 1, 3 and 12 months) into one signal, so the strategy does not depend on a single lucky parameter.
Making trend following work in practice
| Design choice | Why it matters |
|---|---|
| Diversify across markets | A single stock may trend only rarely. Professional programmes trade dozens of equity indices, bonds, currencies and commodities so that some are always trending. |
| Size by volatility | Equal-risk positions stop a single volatile market from dominating. See Risk Management. |
| Use several lookbacks | Averaging signals across horizons reduces parameter risk and smooths turnover. |
| Model costs honestly | Whipsaws multiply trading costs. A rule that looks profitable at zero cost can be a loser at 10 bp per trade. |
| Expect long drawdowns | Trend followers can go one or two years without a new equity high. Know this before you start. |
Crisis alpha. Trend following has historically done well in prolonged bear markets (2008 is the textbook example), because short or flat positions build up as the decline unfolds. That makes it valuable as a diversifier even when its standalone returns are modest. It does far less to protect against sudden one-day crashes, which arrive before any trend signal can react.
Try changing the fast and slow lookbacks, or the breakout windows, in the Strategy Lab, and notice how much the results move. That sensitivity is the subject of the Backtesting page.
Sources & further reading
- Wikipedia contributors, “Trend following”, “Momentum investing”, “Donchian channel”, “Richard Dennis”. Wikipedia, CC BY-SA 4.0.
- Jegadeesh, N. & Titman, S. (1993). Returns to Buying Winners and Selling Losers. Journal of Finance 48(1).
- Moskowitz, T., Ooi, Y. H. & Pedersen, L. H. (2012). Time Series Momentum. Journal of Financial Economics 104(2).
- Hurst, B., Ooi, Y. H. & Pedersen, L. H. (2017). A Century of Evidence on Trend-Following Investing. Journal of Portfolio Management 44(1).